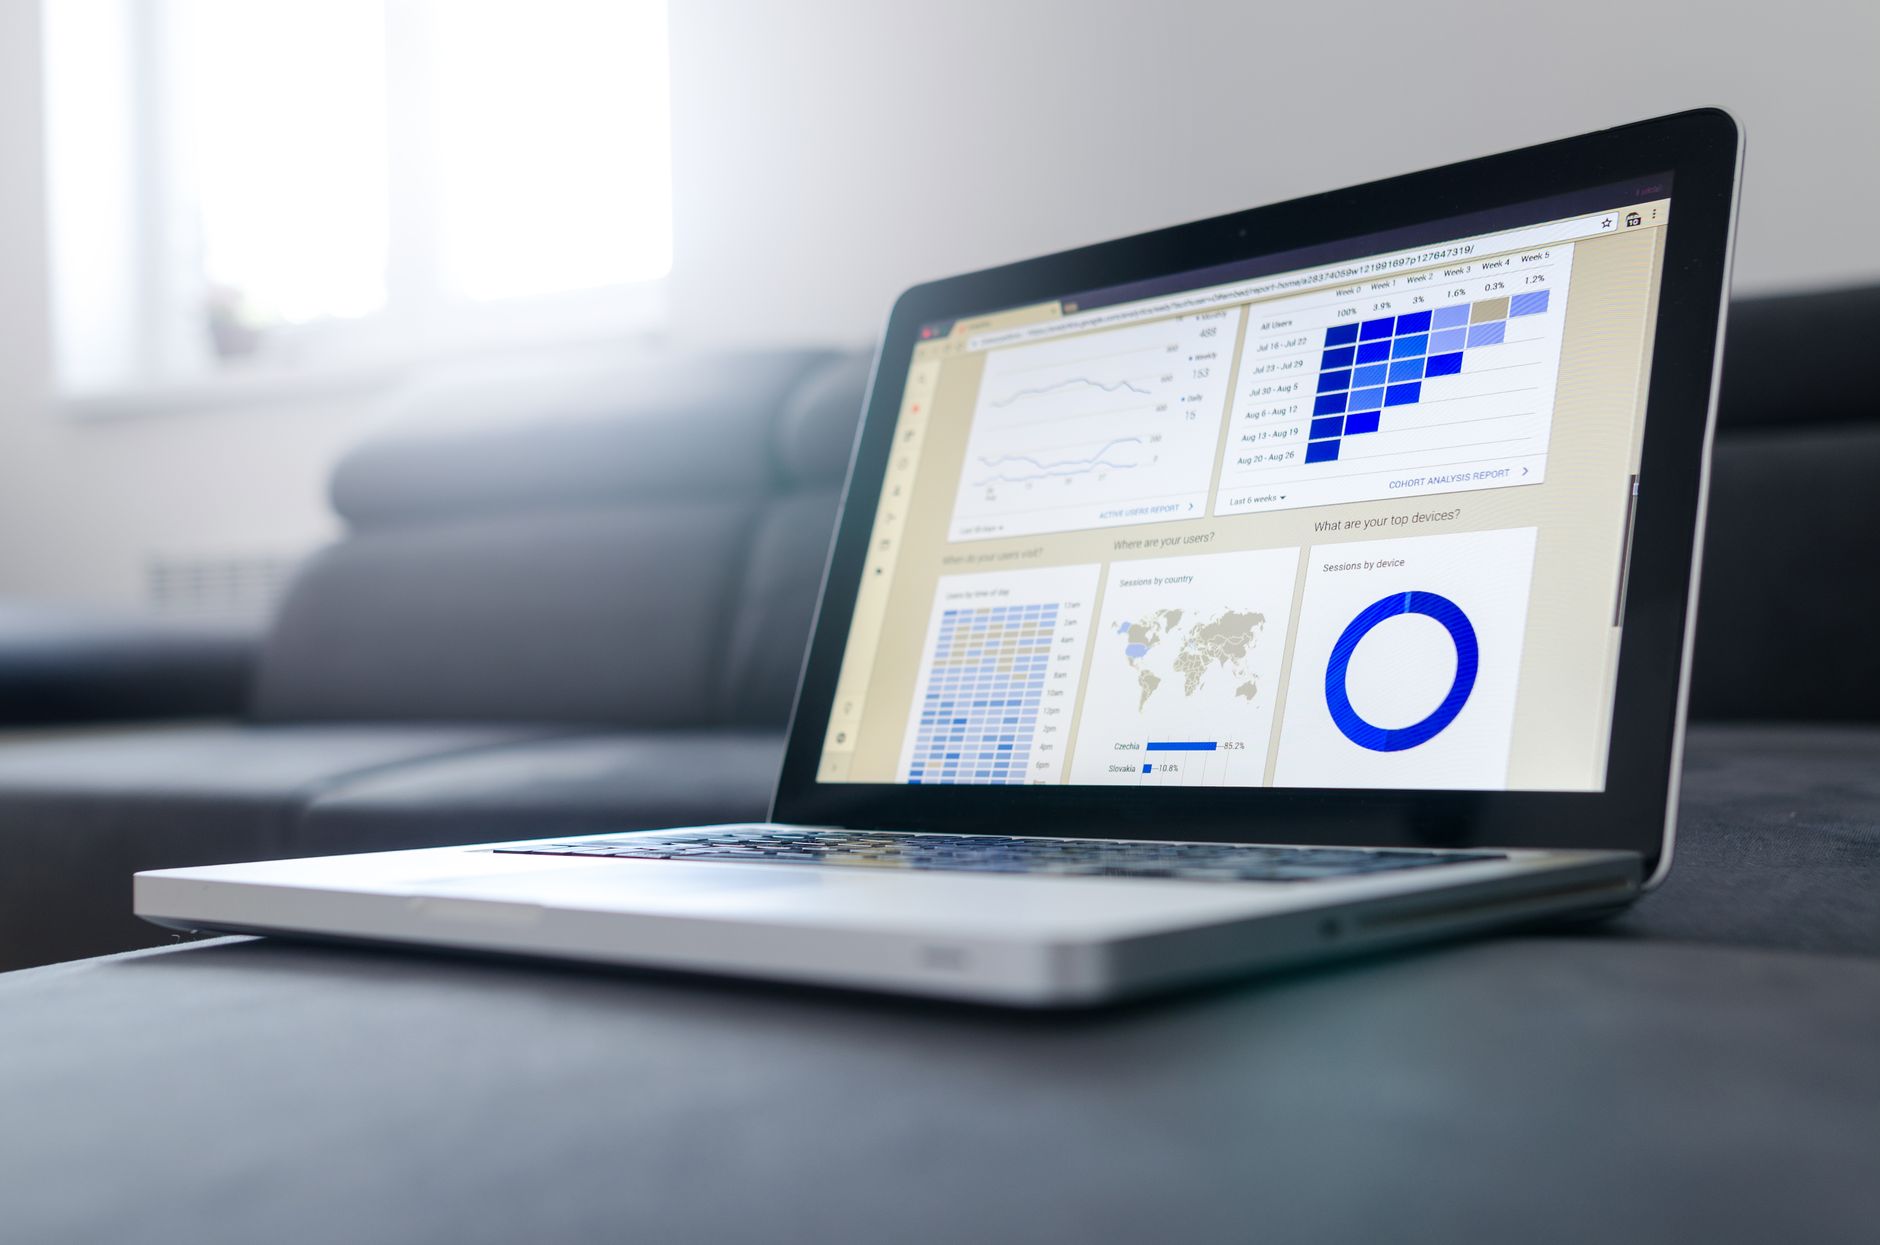
A good executive SEO dashboard is a single, always-current view that turns volatile organic and AI search data into decisions a leader can make in under a minute. It pulls your most important KPIs into one place, lets you compare periods and segments against each other, and removes the need to dig through raw reports or sit through a long presentation to understand performance. Done right, it answers the only question leadership actually asks: is this working, and where.
That last part is the hard part, and it is where most dashboards fall short.
Your organic metrics are changing all the time
SEO has always been a volatile, long-term play. Rankings move, algorithms update, competitors publish, and seasonality pulls traffic in directions that have nothing to do with the work you shipped last month. AI search is just as competitive, if not more. Your brand can be cited in an AI answer one week and absent the next, and the signals that drive those mentions are still being written in real time.
Here is the problem that creates: when the numbers never sit still, a static monthly report is out of date the moment it is sent. You end up explaining last month’s snapshot instead of looking at what is happening now. A live dashboard fixes the timing problem. It is current when you open it, which means the conversation can be about decisions rather than archaeology.
What is an executive SEO dashboard?
An executive SEO dashboard is a centralized, automatically updating report that connects your data sources, such as Google Search Console, Google Analytics, rank tracking, and AI search visibility tools, into one view built for a specific audience. Instead of exporting spreadsheets and rebuilding charts every month, the dashboard refreshes on its own and presents the metrics that matter to whoever is reading it.
The key word is audience. A dashboard built for a CMO is not the same dashboard you hand to a developer or an SEO specialist. The data underneath can be shared; the view on top should not be. More on that below.
What executives need to see at a glance
Executives, you need to be able to judge performance without filters, exports, or a forty-slide deck standing between you and the answer. That means a dashboard with clear KPIs, preset filters, plain-language glossaries for anything technical, and simple function buttons that let you move through the data without a manual.
At a minimum, an executive view should surface:
- Organic traffic and non-branded traffic, separated, so growth is not masked by people already searching your name
- Conversions and revenue from organic, tied to the channel rather than reported in isolation
- Keyword performance over time and average position for the terms that matter to the business
- AI search visibility, including whether your brand is being mentioned and cited in AI answers, and the actual prompts/pages being cited
- Period comparisons built in, so every number arrives with context
The point of the glance is not to oversimplify. It is to let a busy decision-maker read the state of play in five seconds and know exactly where to ask the next question.
The comparisons that turn data into decisions
A single number is trivia. A number next to another number is a decision. The value of a dashboard is not really the metrics; it is the ability to judge those metrics together, against each other.
That means year-over-year and month-over-month comparisons as a default, not a feature you have to go hunting for. It also means any custom date range or filter set the moment a question comes up: brand versus non-brand, conversions and revenue from organic, keyword performance over time, average position, by landing page, by device, by market. When the comparison is one click away, the meeting changes. People stop asking “what is this number” and start asking “what do we do about it.”
Here is a real example. On one account, a period-over-period view showed a real drop in organic clicks. The old instinct would be to treat that as a loss and start reacting. But because the dashboard put AI search visibility right next to the traditional KPIs, the fuller story was obvious: our AI citations and brand mentions were climbing over the same window. We were not losing the audience. We were offsetting some traditional clicks with AI search citations. That is a decision changed by the comparison, not by the raw number.
Why AI search belongs on the same dashboard now
For years, an SEO dashboard meant Google rankings and organic traffic. That is no longer the whole picture. A growing share of discovery happens inside AI answers from ChatGPT, Google AI Overviews, Perplexity, and others, and being invisible there is its own kind of ranking problem.
The catch is that most teams track AI visibility, if at all, in a separate tool with its own login and its own report. That fragmentation defeats the purpose of a dashboard. The whole reason you build one is to see everything in one place. AI search metrics, such as how often your brand is mentioned, whether it is cited with a link, and your share of voice against competitors, belong next to your organic KPIs, compared over the same periods, on the same screen. Treating organic and AI search as one connected story, rather than two disconnected reports, is quickly becoming the difference between a dashboard that reflects reality and one that only tells half of it.
Why most teams don’t have this yet
This is what any good marketing team builds internally, and most leaders know they should have it. The reason they don’t is rarely skill or intent. It is bandwidth. Building a robust, genuinely useful dashboard is upfront work: connecting data sources, reconciling definitions across tools, blending data sets, and designing views for different audiences. That is a real project, and teams already running campaigns often cannot stop to build the thing that would make the campaigns easier to manage.
So the gap is not a failure of leadership. It is a sequencing problem. The dashboard is the kind of foundational investment that pays for itself, but only after someone has the room to build it properly.
How we build custom SEO and AI search dashboards at Next Step SEO
This is one of our specialties. In my full-time capacity as an SEO Specialist, I have built custom reporting dashboards for a range of audiences: executives, media buyers, developers and web operations, and the specialists on SEO, paid, and social teams. The same data, shaped into the view each audience actually needs.
The build usually involves a few things working together. I create custom import files, connect a robust set of Google Data Studio connectors based on what each platform makes available, and tie the fields together using blended data sets and my own filtering and sorting tools. It is the same systems-first approach I bring to my other projects, and I write more about the methodology at rosspinsler.com. The result is one dashboard where the numbers reconcile, the comparisons are built in, and nothing requires a manual to read.
To put that in concrete terms: one client had been relying on an ugly, outdated spreadsheet to track organic traffic, with no useful way to visualize their keyword data. I pulled everything into a single easy-to-read dashboard, with an input template for their sales data sitting alongside live GSC and GA4 connectors. Same information they already had, finally in a form they could actually read and act on.
The part I would point to most, though, is what makes it scalable. I also build templates and instruction manuals for these dashboards, and they are designed to connect to AI chatbots and LLMs. You can take a template and its instructions, hand them to the model you already use, and apply the same reporting structure to your business quickly, without rebuilding the logic from scratch every time. As one example, that same template-and-instructions approach is what let me update and locally optimize the meta tags across more than 100 locations, work that is punishing by hand but moves fast when the structure is already defined. The dashboard stops being a one-off deliverable and becomes a repeatable system.
Let’s build something for your needs
I have helped clients in eCommerce, B2B sales, service-based businesses, and more reach their organic search goals through deliberate planning, valuable reporting, and focused roadmapping. If your team knows it needs better visibility but has not had the bandwidth to build it, that is exactly the gap we fill. You can see the specifics of our custom SEO reports for clients, or read on for how to bring AI search into the same view.
[ CTA PLACEHOLDER — Ross to replace: add booking link / contact button / email here ]
Example: Book a dashboard build call → or Email me at [your email]
Frequently asked questions
What is the difference between an SEO dashboard and an SEO report? A report is a snapshot, usually exported and sent on a schedule, so it is out of date the moment it lands. A dashboard is a live view that updates on its own and lets the reader explore the data, compare periods, and answer follow-up questions without waiting for the next report.
What KPIs should an executive SEO dashboard include? At a minimum: organic and non-branded traffic, conversions and revenue from organic, keyword performance and average position over time, and AI search visibility. Each should be viewable with year-over-year and month-over-month comparisons and segmentable by things like landing page, device, and market.
Should AI search visibility be in the same dashboard as traditional SEO? Yes. Discovery increasingly happens inside AI answers, and tracking it in a separate tool fragments the picture. Keeping AI search metrics next to your organic KPIs, compared over the same periods, gives you the full story in one place.
Can I build an SEO dashboard for free? Largely, yes. Google Data Studio connects to Google Search Console and Google Analytics at no cost. The expense is not the software; it is the time and expertise to connect the sources, blend the data correctly, and design views for different audiences, which is why many teams choose to have it built for them.
Should every stakeholder see the same dashboard? No. The underlying data can be shared, but the view should be tailored. An executive needs a one-glance summary; a developer needs technical detail; a specialist needs working metrics. One data foundation, several purpose-built views.
About the author
Ross Pinsler is an SEO Specialist who builds custom reporting dashboards for executives, media buyers, web operations teams, and marketing specialists. He writes about SEO, analytics, and building data systems at rosspinsler.com, he was a co-founder of Swish Theory, and shares work and audits on LinkedIn. Through Next Step SEO, he helps brands turn volatile organic and AI search data into clear, decision-ready reporting.